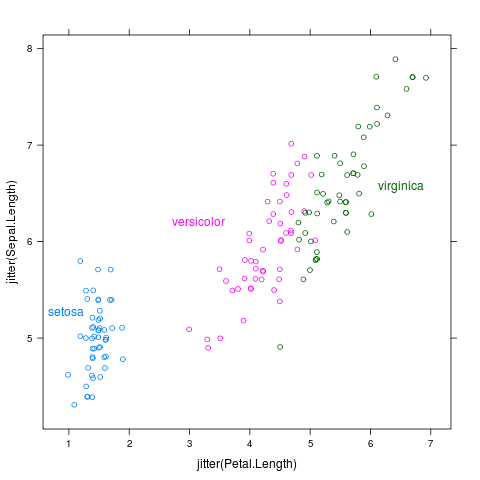
directlabels - scatterplot - example - iris

library(lattice)
p <- xyplot(jitter(Sepal.Length)~jitter(Petal.Length),iris,groups=Species)
ahull.grid

Label the closest point on the alpha hull of the data.

direct.label(p,"ahull.grid")
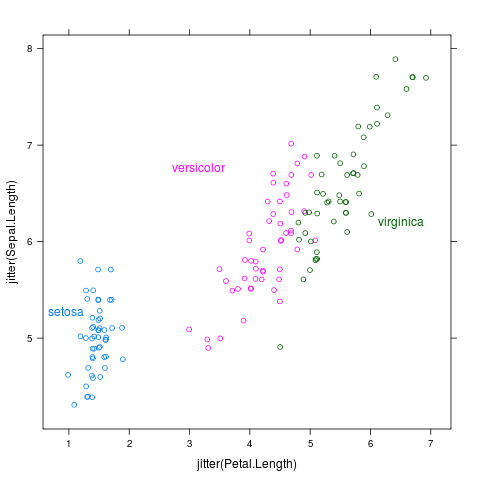
  
chull.grid

Label the closest point on the convex hull of the data.

direct.label(p,"chull.grid")
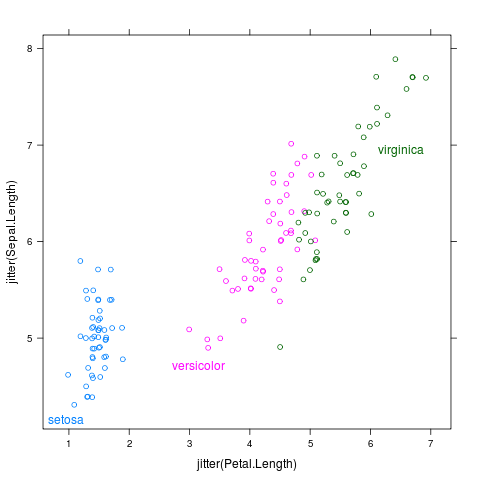
  
extreme.grid

Label each point cloud near the extremities of the plot region.

direct.label(p,"extreme.grid")
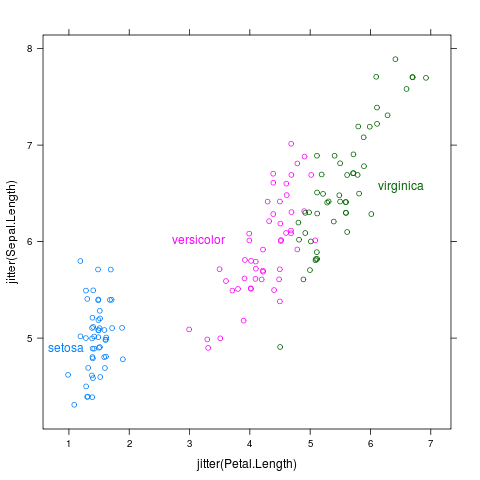
  
smart.grid

Search the plot region for a label position near the center of each point cloud.

direct.label(p,"smart.grid")
  
Please contact Toby Dylan Hocking if you are using directlabels or have ideas to contribute, thanks!
Documentation website generated from source code version 2021.2.24 (git revision edd0c5b Mon, 28 Jun 2021 10:54:29 +0530) using inlinedocs.
validate