directlabels - densityplot - Positioning Method - top.bumptwice

Label the tops, bump labels up to avoid other labels, then to the side to avoid collisions with points.

top.bumptwice <- function(d,debug=FALSE,...){
  labtab <- apply.method("top.bumpup",d)
  if(debug)draw.rects(labtab)
  gapply(labtab,function(l,...){
    between <- d[d$y>l$bottom & d$y<l$top,]
    x <- sort(c(range(d$x),between$x))
    if(length(x)==2)return(l)
    dif <- diff(x)
    ok <- dif>with(l,right-left)
    if(!any(ok))ok[1] <- TRUE
    i <- which(ok)
    intervals <- data.frame(left=x[i]+l$w/2,right=x[i+1]-l$w/2,i=seq_along(i))
    molt <- with(intervals,data.frame(i,x=c(left,right)))
    dists <- transform(molt,dist=x-l$x)
    best <- dists[which.min(abs(dists$dist)),]
    besti <- intervals[best$i,]
    l$x <- if(l$x<besti$right & l$x>besti$left)l$x else best$x
    l
  })
}
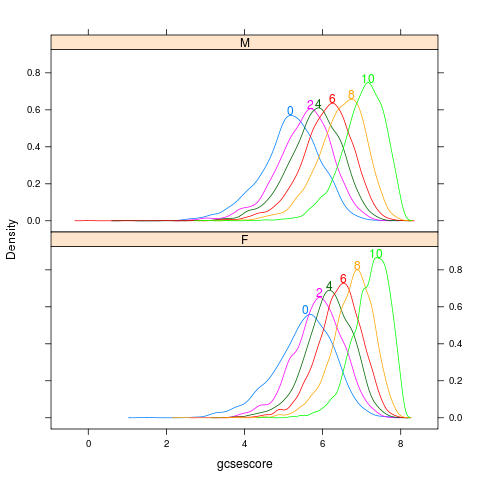
chemscore

chemscore

data(Chem97,package="mlmRev")
library(lattice)
p <- densityplot(~gcsescore|gender,Chem97,
            groups=factor(score),layout=c(1,2),
            n=500,plot.points=FALSE)
direct.label(p,"top.bumptwice")
  
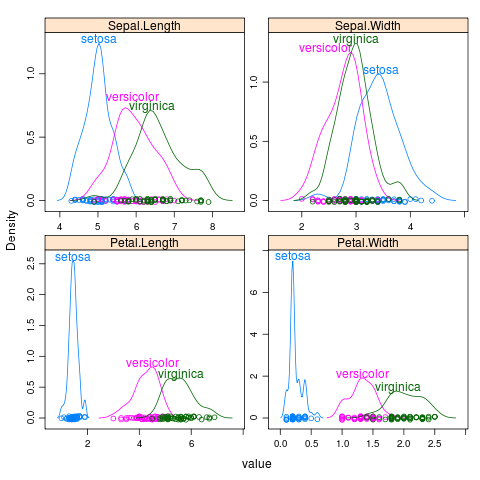
iris

iris

library(reshape2)
iris2 <- melt(iris,id="Species")
library(lattice)
p <- densityplot(~value|variable,iris2,groups=Species,scales="free")
direct.label(p,"top.bumptwice")
  
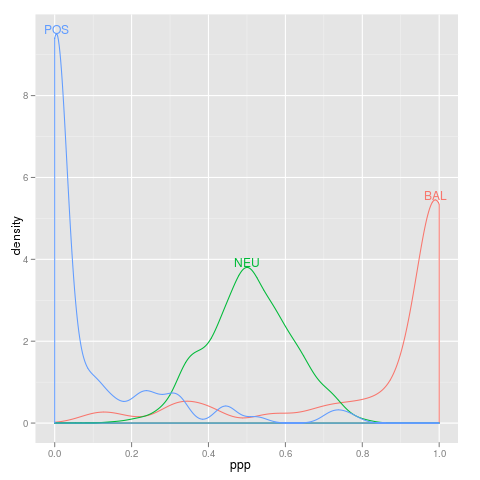
loci

loci

loci <- data.frame(ppp=c(rbeta(800,10,10),rbeta(100,0.15,1),rbeta(100,1,0.15)),
                   type=factor(c(rep("NEU",800),rep("POS",100),rep("BAL",100))))
library(ggplot2)
p <- qplot(ppp,data=loci,colour=type,geom="density")
direct.label(p,"top.bumptwice")
  
Please contact Toby Dylan Hocking if you are using directlabels or have ideas to contribute, thanks!
Documentation website generated from source code version 2021.2.24 (git revision edd0c5b Mon, 28 Jun 2021 10:54:29 +0530) using inlinedocs.
validate