Since data science is half visualization (an area R excels at), it would seem like an incomplete project if no kind of visualization is provided, concerning which the thought of creating a simple plotting function seemed like a yes for me. It’s not in our primary objectives or goes with the ad-hoc approach, but is nevertheless, useful to visually capture the trend of benchmarked data and gather conclusive remarks based on it.
Function Details : Parameters
The primary parameter data.df is a data frame composed of the columns Timings/Memory usage and Data sizes, as returned by asymptoticTimings/asymptoticMemoryUsage for time/memory cases respectively. Passing this data frame alone is enough, with the rest parameters being optional.
Optional parameters
| Parameter | Description | Defaults |
|---|---|---|
| titles | A list composed of two string objects, the first of which assigns the title and the later, the subtitle. | Empty strings i.e. list("", "") |
| labels | A list of two elements containing strings for x and y labels respectively. | list("Data size", "Runtime (in nanoseconds)") |
| point.alpha | A numeric value denoting transparency level (in the range 0 to 1) for point geometry. | No transparency, or 1 |
| line.alpha | A numeric value denoting transparency level (in the range 0 to 1) for line geometry. | No transparency, or 1 |
| point.color | A string specifying a known color or a representation in hexcode for point geometry. | black or hex equivalent #000000 |
| line.color | A string specifying a known color or a representation in hexcode for line geometry. | black or hexcode #000000 |
| point.size | A numeric value denoting the size of point geometry. | 1.3 |
| line.size | A numeric value denoting the size of line geometry. | 0.7 |
Function Details : Implementation
A simple implementation follows, wherein a ggplot class object is created with aesthetic mapping between the two parameters prevalent in the passed data frame (used for the entire graphic), intended to be common throughout all subsequent layers unless specifically overridden (reason why we don’t need to specify aesthetics again in geometry). To show the plotted points (with variance) and lines, point and line geometry are added. A logarithmic (base 10) scale is applied to both axes. Hardcoded/default labels are set up with empty titles, both of which can be modified. The plot object with these addons is then returned.
Once I inculcate more experience with ggplot2, I may add more options, most of which are parameter adjustments to the imposed line and point geometry currently.
Function Details : Return value
The function returns a ggplot object, which can be further customized as per the user’s preference with extra toppings such as scales, themes (default is grey/theme_grey()) etcetera.
Usage
1Simply pass the dataframe with benchmarked timings/memory-allocations from asymptoticTimings/asymptoticMemoryUsage:
df.time <- asymptoticTimings(PeakSegDP::cDPA(rpois(N, 1), max.segments = 3L), data.sizes = 10^seq(1, 4))
plotTimings(df.time)
df.memory <- asymptoticMemoryUsage(PeakSegDP::cDPA(rpois(N, 1), maxSegments = 3L), data.sizes = 10^seq(1, 5, by = 0.1))
plotMemoryUsage(df.memory)
2or additionally tweak it to your preference with the optional parameters:
plotTimings(df.time, titles = list("Timings plot", "PeakSegDP::cDPA"), labels = list("Data size", "Runtime (nanoseconds)"), point.alpha = 1, line.alpha = 0.8, point.color = "tomato", line.color = "#43464B", point.size = 2, line.size = 1)
plotMemoryUsage(df.memory, titles = list("Memory usage plot", "PeakSegDP::cDPA"), labels = list("Data size", "Memory size (bytes)"), point.alpha = 1, line.alpha = 0.8, point.color = "tomato", line.color = "#43464B", point.size = 2, line.size = 1)
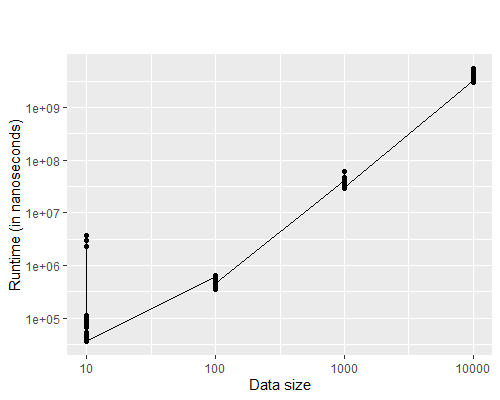
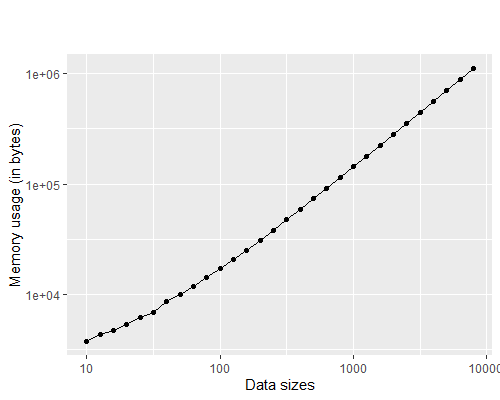
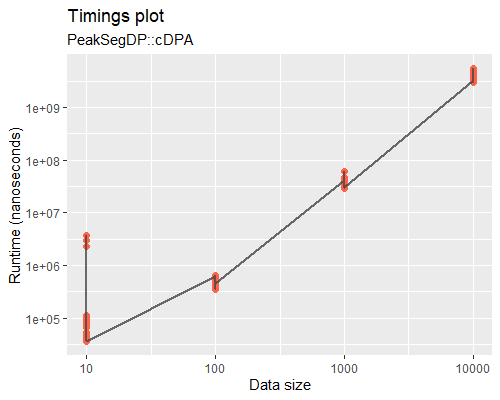
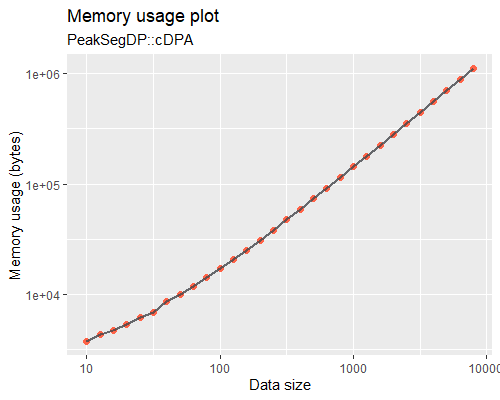
In addition, comparison plots can be made by appropriately adding a third column (to help distinguish by aesthetics based on it) with a unique value for each of the data frames, combining them using an rbind() and then plotting the resultant data frame using suitable aesthetics, geometry, scale, labels/titles etcetera via a ggplot:
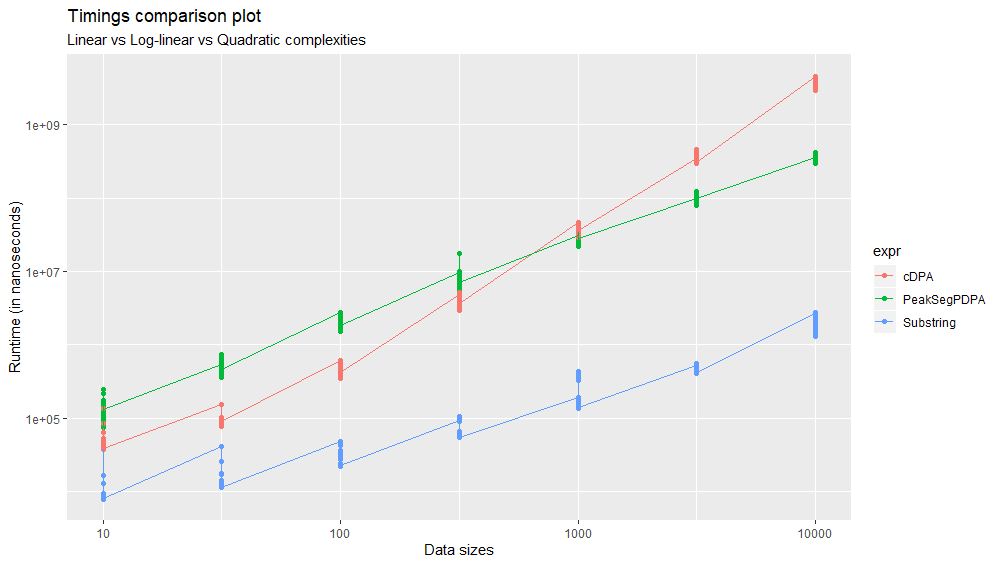


Code for the above can be found here.
Code
plotTimingsplotTimings = function(data.df, titles = list("", ""), labels = list("Data size", "Runtime (in nanoseconds)"), point.alpha = 1, line.alpha = 1, point.color = "black", line.color = "black", point.size = 1.3, line.size = 0.7) { # Check for required columns in input data frame: if(class(data.df) == "data.frame" & "Timings" %in% colnames(data.df) & "Data sizes" %in% colnames(data.df)) { # Create a ggplot object with aesthetic mapping between Timings vs Data sizes, point and line geometry with set transparency level, appropriate labels, logarithmtic (base 10) scale and appropriate title and subtitle: plot.obj <- ggplot(data.df, aes(x = `Data sizes`, y = Timings)) + geom_point(alpha = point.alpha, color = point.color, size = point.size) + geom_line(alpha = line.alpha, color = line.color, size = line.size) + labs(x = labels[[1]], y = labels[[2]]) + scale_x_log10() + scale_y_log10() + ggtitle(titles[[1]], subtitle = titles[[2]]) # Return it: return(plot.obj) } # Stop if the input data frame does not contain the required columns: else stop("Input parameter must be a data frame with columns 'Timings' and 'Data sizes'") }plotMemoryUsageplotMemoryUsage = function(data.df, titles = list("", ""), labels = list("Data sizes", "Memory usage (in bytes)"), point.alpha = 1, line.alpha = 1, point.color = "black", line.color = "black", point.size = 1.3, line.size = 0.7) { # Check for required columns in input data frame: if(class(data.df) == "data.frame" & "Memory usage" %in% colnames(data.df) & "Data sizes" %in% colnames(data.df)) { # Create a ggplot object with aesthetic mapping between `Memory usage` vs `Data sizes` columns, point and line geometry with set transparency level, appropriate labels, logarithmtic (base 10) scale and appropriate title and subtitle: plot.obj <- ggplot(data.df, aes(x = `Data sizes`, y = `Memory usage`)) + geom_point(alpha = point.alpha, color = point.color, size = point.size) + geom_line(alpha = line.alpha, color = line.color, size = line.size) + labs(x = labels[[1]], y = labels[[2]]) + scale_x_log10() + scale_y_log10() + ggtitle(titles[[1]], subtitle = titles[[2]]) # Return it: return(plot.obj) } # Stop if the input data frame does not contain the required columns: else stop("Input parameter must be a data frame with columns 'Memory usage' and 'Data sizes'") }rxoygen-documented versions:
- testComplexity/R/plotTimings
- testComplexity/R/plotMemoryUsage
| Anirban | 07/10/2020 |