While prepping for the GRE, I came across questions which involved a circle inscribed within a square such as the ones below:
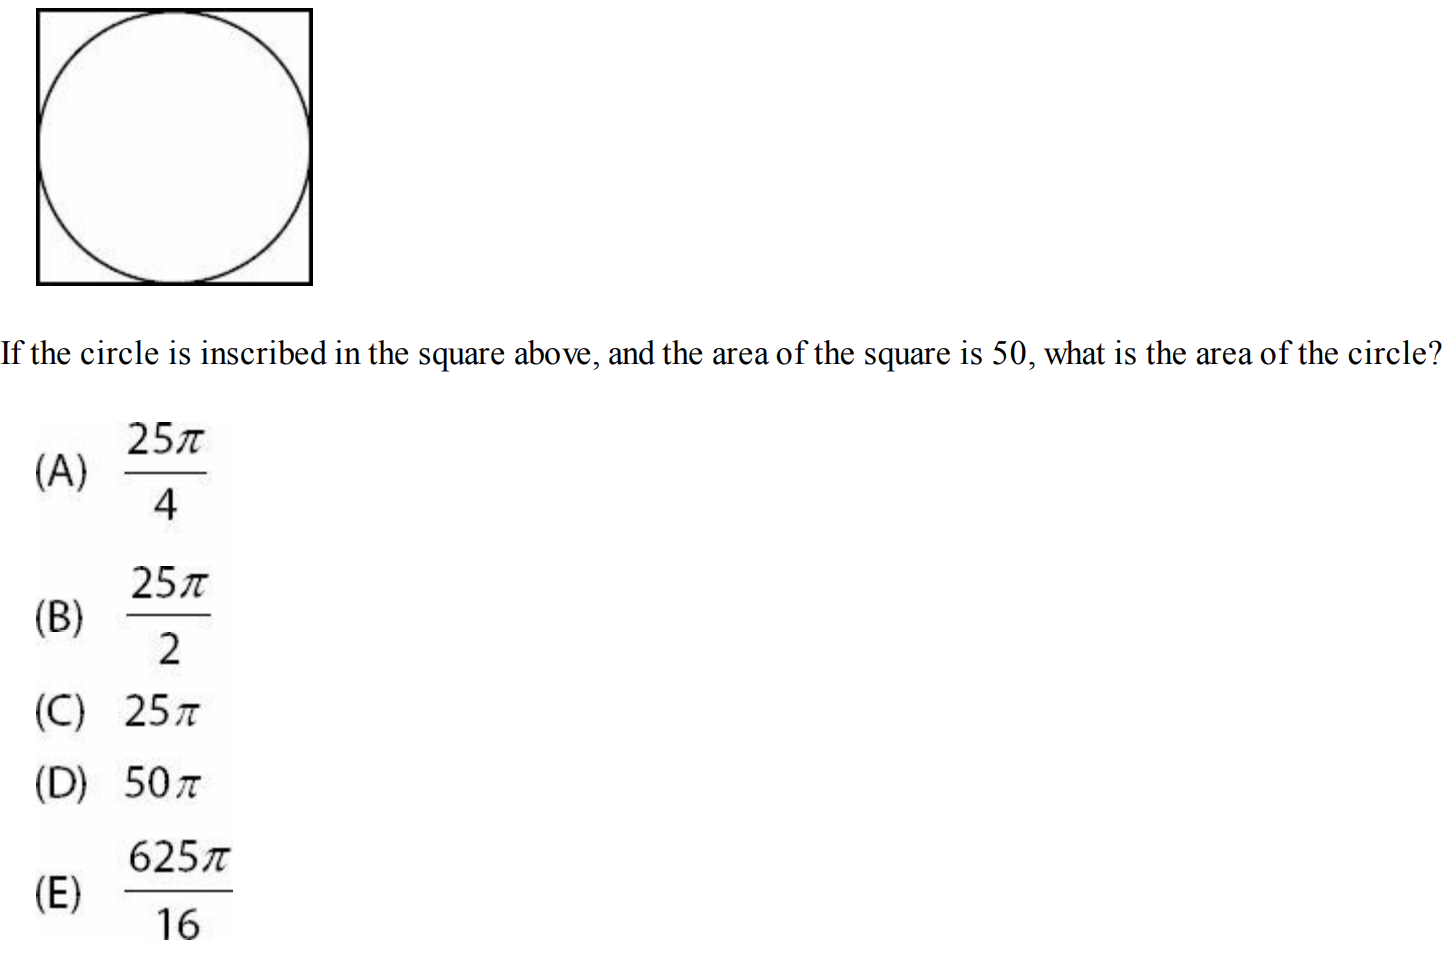
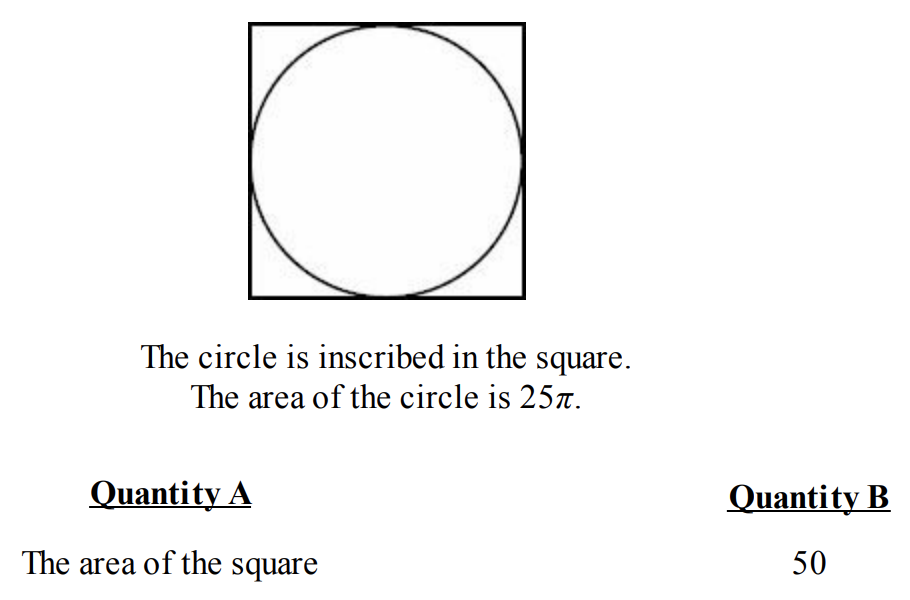
As the radius of such a circle inscribed within a square would be half the length of a side of the square, the ratio of their areas would be:
Casually thinking, this seems like a simple equation to quickly reuse for such problems, but you might be unaware that a Monte Carlo method exists for the estimation of Pi (ratio of a circle’s circumference to its diameter) that uses this very same result, i.e.:
Apparently, we can compute the value of Pi in a program precisely for a few decimal places by this method, by considering randomly emplaced points within a square grid, and then using this formula in conjunction with the area of the respective figures being designated by the points they enclose.
Here’s a simple take: (Initially implemented it in C++ as I did for my Skewness and Kurtosis post, but then resorted to Python since I thought to generate a plot)
import random
import matplotlib.pyplot as plt
# Initialize the total number of points to consider: (preferably a large number)
totalPoints = int(1e+5)
# Initialize a counter variable to count the number of points lying inside the circle:
circlePoints = 0
# Looping through the total number of points considered:
for i in range(nums):
# Generating random numbers for (x, y) pair points from a uniform distribution with range of values from -1 to 1:
randomX = random.uniform(-1, 1)
randomY = random.uniform(-1, 1)
# If a point (x, y) satisfies the equation of a circle (x^2 + y^2 <= 1) i.e. it lies inside or on the circumference of the circle, then I increment the counter accounting for the number of points the circle has:
if (randomX**2 + randomY**2) <= 1:
circlePoints += 1
# Plot black points for the circle:
plt.plot(randomX, randomY, 'k.')
else:
# Plot red points for the square:
plt.plot(randomX, randomY, 'r.')
# Estimate value of Pi with the formula taken into account:
pi = 4 * circlePoints / totalPoints
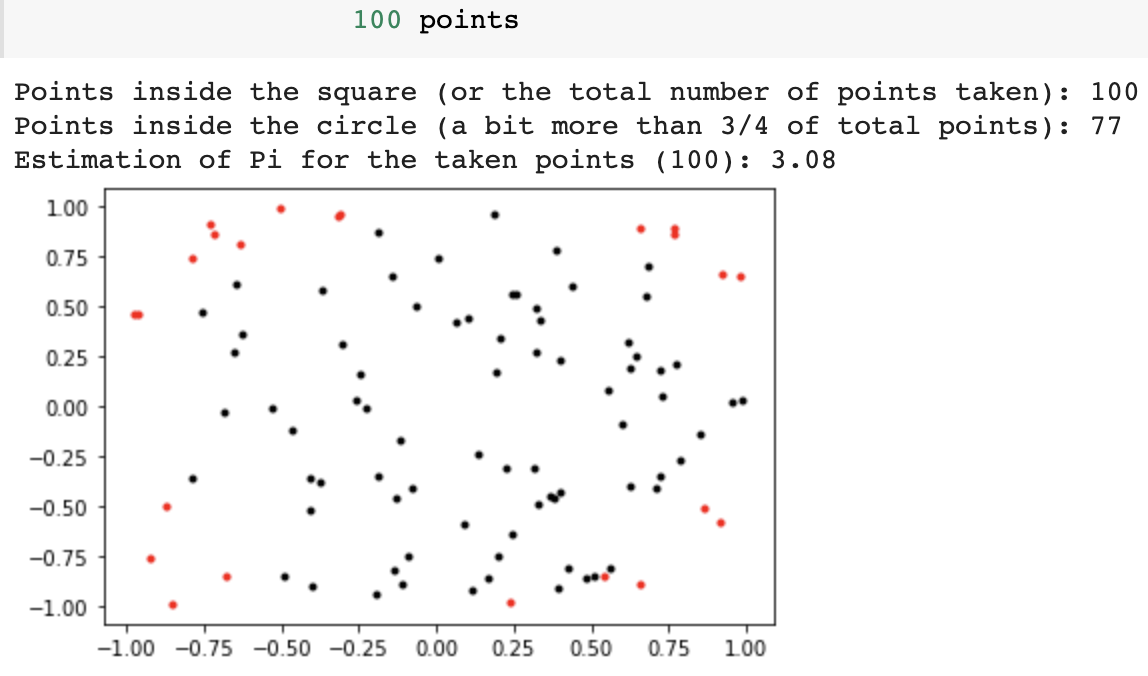
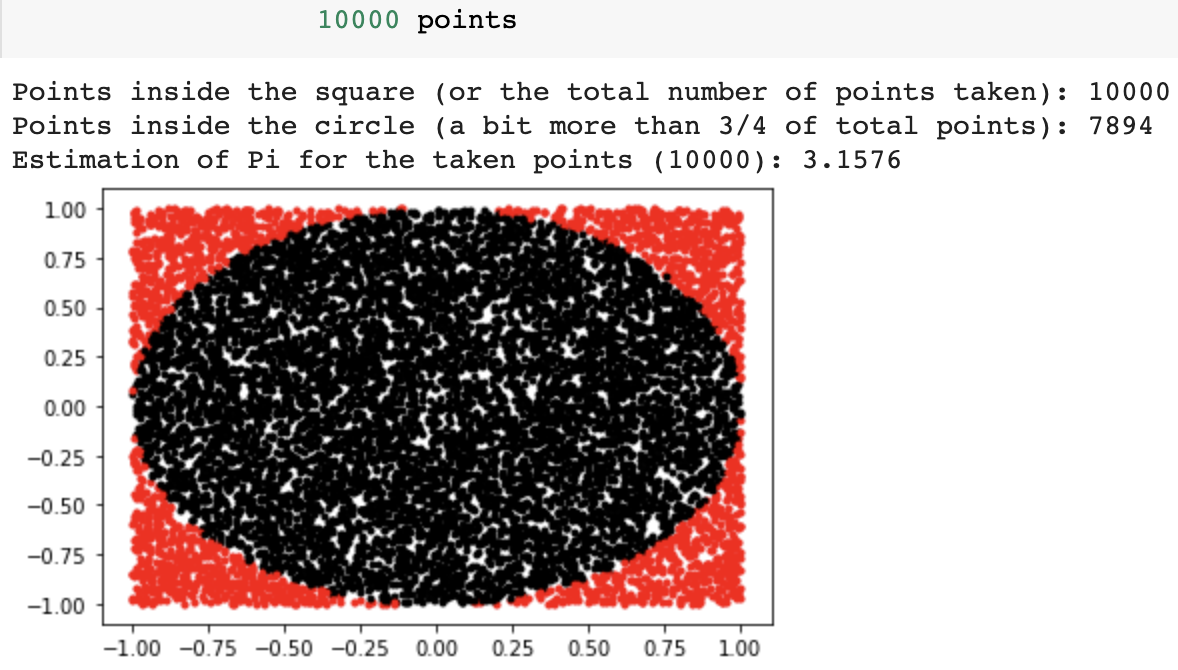
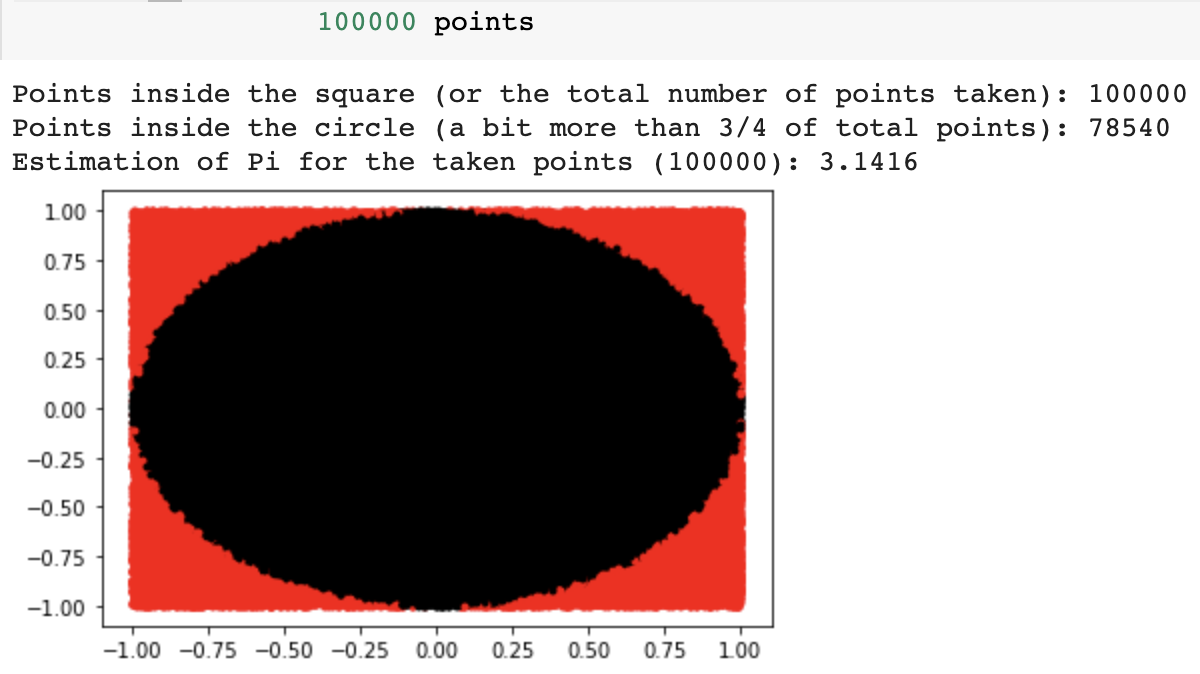
print("Points inside the square (or the total number of points taken):", nums)
print("Points inside the circle (a bit more than 3/4 of total points):", circlePoints)
print("Estimation of Pi for the taken points (" + str(nums) + "): " + str(pi))
plt.show()
The more number of points we take, the more precise the estimation of Pi would be. Plots would make this clear, as well as visually discernable:
I ran this on Google Colab, and there are two defects I’ve observed while doing this:
- Considering
totalPointsas 106 or more while generating a plot for them will lead to a crash due to the excessive use of RAM (slowly, the indicator on the top right will overclock) and the lack of a long enough runtime, unless you’re using Colab Pro (which comes with higher GPUs plus more allocated memory and runtime). This irrevocably happens every time, so take that as a threshold - unless you’re just computing the value of Pi with 106 points and not plotting the same. (which works just fine with the provided computation power) - Colab’s Dark mode doesn’t render the entire plot with a proper inverse color scheme. For the above plots, I’m using the light mode to avoid the white-black contrast and show the axis markings clearly.
No doubt, this isn’t the most effective way to compute π by simply upscaling the quantity of points considered in order to achieve higher precision, something which is beyond the current scope with Monte Carlo and would instead require a more commensurate approach. (y-cruncher perhaps?)
| Anirban | 02/03/2021 |